Central American Mean Annual Air Temperature
30 Minute Resolution

| Download | |
|---|---|
| Postscript version of this map | ASCII Grid version of Mean Annual Air Temperature Data |
| Download | |
|---|---|
| Postscript version of this map | ASCII Grid version of Mean Annual Air Temperature Data |
ncols         130
nrows         80
xllcorner     -120
yllcorner     -5
cellsize      0.5
NODATA_value  -9999
15 15.8 15.6 16.2 15.2 13.2 12.6 15.5 21 22.1 22.5 22.4 21.3 18.8 14.5 11.7
16.5 15.7 10.7 9.3 10.6 10.8 10 8.9 8 9.9 11.6 8.5 10.5 11.5 12.8 13.8 14.2
14.1 14.1 14 14.3 15.4 15.9 16.2 16.8 17 17 16.6 16.8 16.9 17.2 17.1 17.4 17.2
16.9 16.5 16.4 16.2 17.1 16.4 17 17 17.1 17.1 16.9 16.8 16.5 16.5 16.1 16 16.2
16 15.8 15.5 15.8 15.4 15 15.6 16.2 16.4 16.6 16.7 16.7 16.9 16.9 17.2 17.2
17.4 17 16.8 17.4 17.5 17.3 17.8 19 20.5 20.3 20.6 20.4 20.1 19.7 20 20.5 20.9
20.8 20.9 20.9 20.9 20.9 20.9 21 20.9 20.9 21 21.1 21.1 21 21.1 21.1 21.1 21.2
21.2 21.2 21.2 21.3 21.2 21.2 21.2 21.1 21.1 21.2 21.1 21.1 21.2
Each value represents mean annual air temperature values for each 0.5 degree resolution pixel. Values of -9999 are representative of no data.
Full Year Animated  |  |
|
|---|---|---|
Click Postscript or ASCII Data to download a Postscript Map or an ASCII Grid version of that month's data. |
||
January 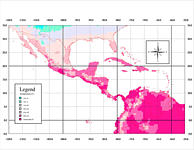 Postscript |
February 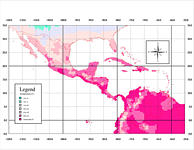 Postscript |
March 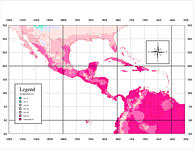 Postscript |
April 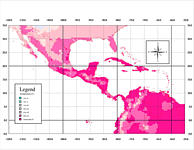 Postscript |
May  Postscript |
June  Postscript |
July  Postscript |
August  Postscript |
September  Postscript |
October 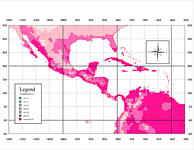 Postscript |
November 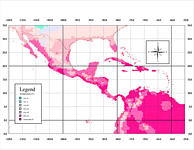 Postscript |
December  Postscript |
ncols         130
nrows         80
xllcorner     -120
yllcorner     -5
cellsize      0.5
NODATA_value  -9999
10.4 10.1 9.1 8.9 6.2 4.2 4.3 6.2 10.1 10.9 11.1 11 10.1 8.1 4.9 1.9 5.7 5.6
1.1 0.7 -0.3 -0.2 -0.8 -1.4 -1.6 -0.3 0.6 -1.8 0.2 1.4 2.9 3.4 3.2 2.9 2.8 2.9
3.4 4.1 4.1 3.9 4.1 4.4 4.7 4.3 4.5 4.8 5.1 5.1 5.3 5.5 5.5 5.4 5.4 5.3 6.2 5.6
5.9 6 6.4 6.2 6 6.2 6 5.8 5.4 5 5.7 5.9 6 5.3 5.6 5.9 5.3 5.9 6.4 6.5 6.7 7.1
6.8 7.1 7 7.9 7.9 8.6 8.2 7.9 8.1 8.8 8.7 9.8 12 14.8 14.7 15.5 15.3 14.6 14
14.5 15.6 16.2 16.1 16.3 16.4 16.3 16.4 16.5 16.7 16.7 16.7 16.9 17.1 17 16.9
17.1 17.2 17.2 17.3 17.3 17.4 17.5 17.6 17.7 17.7 17.7 17.7 17.7 17.9 17.9 17.8
17.9
Each value represents mean annual air temperature values for each 0.5 degree resolution pixel. Values of -9999 are representative of no data.