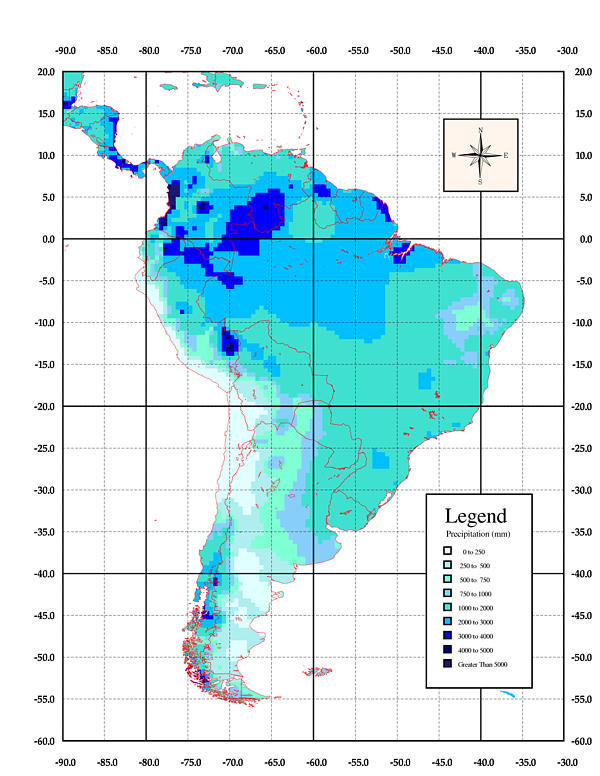
South American Total Annual Precipitation
30 Minute Resolution
| Download | |
|---|---|
| Postscript version of this map | ASCII Grid version of Total Annual Precipitation Data |
| Download | |
|---|---|
| Postscript version of this map | ASCII Grid version of Total Annual Precipitation Data |
ncols         120
nrows         160
xllcorner     -90
yllcorner     -60
cellsize      0.5
NODATA_value  -9999
1220 1290 1267 1171 1180 1347 1522 1516 1498 1481 1441 1319 1133 972 869 930
1091 1279 1323 1316 1434 1566 1557 1329 925 1037 1214 1331 1191 1049 993 1208
1300 1326 1435 1534 1927 1390 1101 1452 2016 2256 2177 1752 1109 874 1129 1326
1450 1414 1220 1219 1350 1441 1266 1089 1004 1005 1030 1001 963 918 892 860 846
845 889 902 886 893 903 905 906 934 935 908 906 910 927 903 865 823 798 765 741
732 774 781 754 722 707 699 685 662 655 690 683 668 636 583 520 451 398 378 361
357 380 377 350 336 334 320 299 298 293 277 275 279 294 266
Each value represents total annual precipitation values for each 0.5 degree resolution pixel. Values of -9999 are representative of no data.
Full Year Animated  |  |
|
|---|---|---|
Click Postscript or ASCII Data to download a Postscript Map or an ASCII Grid version of that month's data. |
||
January  Postscript |
February  Postscript |
March  Postscript |
April 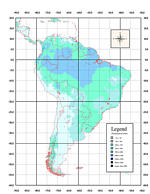 Postscript |
May 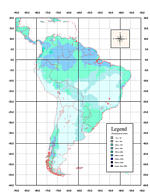 Postscript |
June 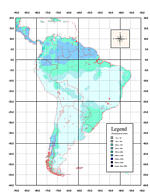 Postscript |
July 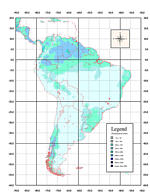 Postscript |
August 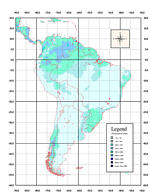 Postscript |
September 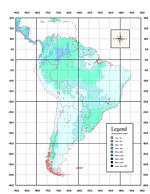 Postscript |
October  Postscript |
November 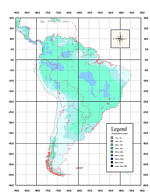 Postscript |
December 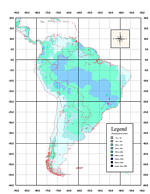 Postscript |
ncols         120
nrows         160
xllcorner     -90
yllcorner     -60
cellsize      0.5
NODATA_value  -9999
32 39 51 48 53 -9999 -9999 -9999 -9999 -9999 -9999 -9999 -9999 -9999 -9999
-9999 -9999 -9999 -9999 -9999 -9999 -9999 -9999 -9999 -9999 -9999 -9999 -9999
-9999 -9999 -9999 -9999 -9999 85 55 44 86 47 51 106 -9999 -9999 -9999 -9999
-9999 -9999 -9999 -9999 -9999 -9999 -9999 -9999 -9999 -9999 -9999 -9999 -9999
-9999 -9999 -9999 -9999 -9999 -9999 -9999 -9999 -9999 -9999 -9999 -9999 -9999
-9999 -9999 -9999 -9999 -9999 -9999 -9999 -9999 -9999 -9999 -9999 -9999 -9999
-9999 -9999 -9999 -9999 -9999 -9999 -9999 -9999 -9999 -9999 -9999 -9999 -9999
-9999 -9999 -9999 -9999 -9999 -9999 -9999 -9999 -9999 -9999 -9999 -9999 -9999
-9999 -9999 -9999 -9999 -9999 -9999 -9999 -9999 -9999 -9999 -9999
Each value represents total annual precipitation values for each 0.5 degree resolution pixel. Values of -9999 are representative of no data.