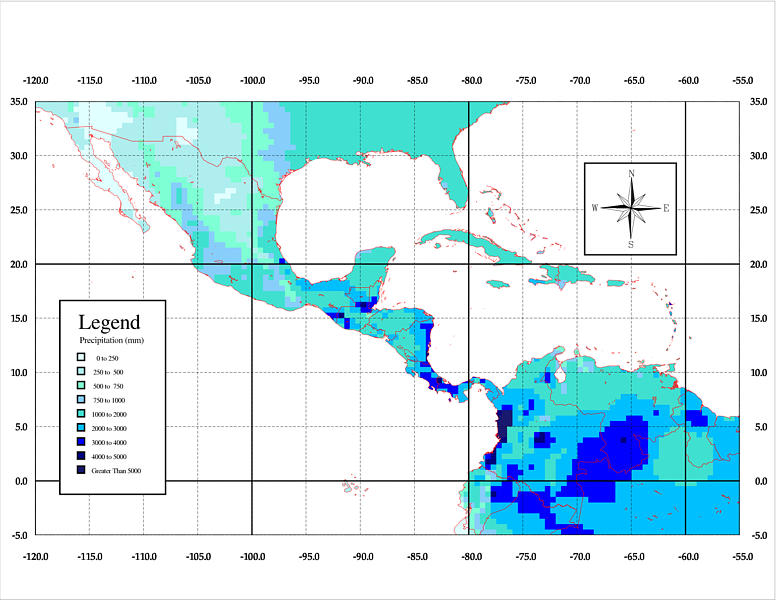
Central American Total Annual Precipitation
30 Minute Resolution
| Download | |
|---|---|
| Postscript version of this map | ASCII Grid version of Total Annual Precipitation Data |
| Download | |
|---|---|
| Postscript version of this map | ASCII Grid version of Total Annual Precipitation Data |
ncols         130
nrows         80
xllcorner     -120
yllcorner     -5
cellsize      0.5
NODATA_value  -9999
399 444 466 394 346 353 685 371 95 87 106 130 179 259 413 528 382 517 642 495
367 363 324 319 358 334 332 525 384 379 387 372 392 464 523 602 569 604 613 625
663 720 780 837 910 1031 1075 1129 1246 1366 1495 1493 1474 1436 1457 1463 1385
1393 1400 1426 1406 1425 1491 1440 1436 1433 1386 1384 1451 1522 1450 1487 1640
1558 1453 1332 1302 1252 1228 1221 1259 1240 1319 1340 1383 1461 1471 1484 1512
1528 1521 1468 1408 1350 1324 1310 1287 1268 1262 1333 1435 1497 1573 1611 1621
1620 1601 1625 1649 1661 1670 1673 1670 1651 1639 1676 1678 1665 1613 1593 1564
1559 1544 1567 1565 1557 1533 1543 1550 1511
Each value represents total annual precipitation values for each 0.5 degree resolution pixel. Values of -9999 are representative of no data.
Full Year Animated  |  |
|
|---|---|---|
Click Postscript or ASCII Data to download a Postscript Map or an ASCII Grid version of that month's data. |
||
January  Postscript |
February 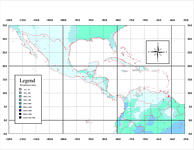 Postscript |
March 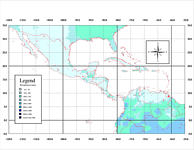 Postscript |
April 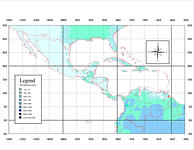 Postscript |
May 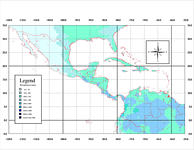 Postscript |
June 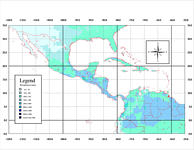 Postscript |
July 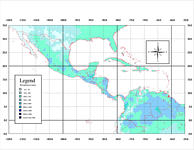 Postscript |
August 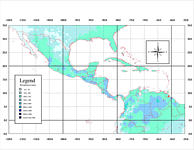 Postscript |
September 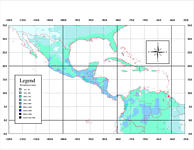 Postscript |
October 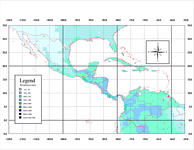 Postscript |
November 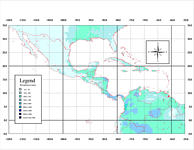 Postscript |
December 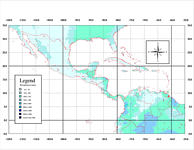 Postscript |
ncols         130
nrows         80
xllcorner     -120
yllcorner     -5
cellsize      0.5
NODATA_value  -9999
84 98 102 75 65 64 130 70 15 13 15 17 22 33 52 55 33 56 74 45 28 27 20 24 25 16
21 38 20 16 12 11 12 13 16 17 17 23 25 21 24 26 28 34 43 50 61 59 73 93 110 120
125 131 143 148 136 148 156 156 157 151 174 159 177 147 150 128 144 153 138 143
162 151 135 121 117 105 98 91 83 79 95 85 92 104 105 -9999 -9999 -9999 -9999
-9999 -9999 -9999 -9999 -9999 -9999 -9999 -9999 -9999 -9999 -9999 -9999 -9999
-9999 -9999 -9999 -9999 -9999 -9999 -9999 -9999 -9999 -9999 -9999 -9999 -9999
-9999 -9999 -9999 -9999 -9999 -9999 -9999 -9999 -9999 -9999 -9999 -9999 -9999
Each value represents total annual precipitation values for each 0.5 degree resolution pixel. Values of -9999 are representative of no data.